What I built
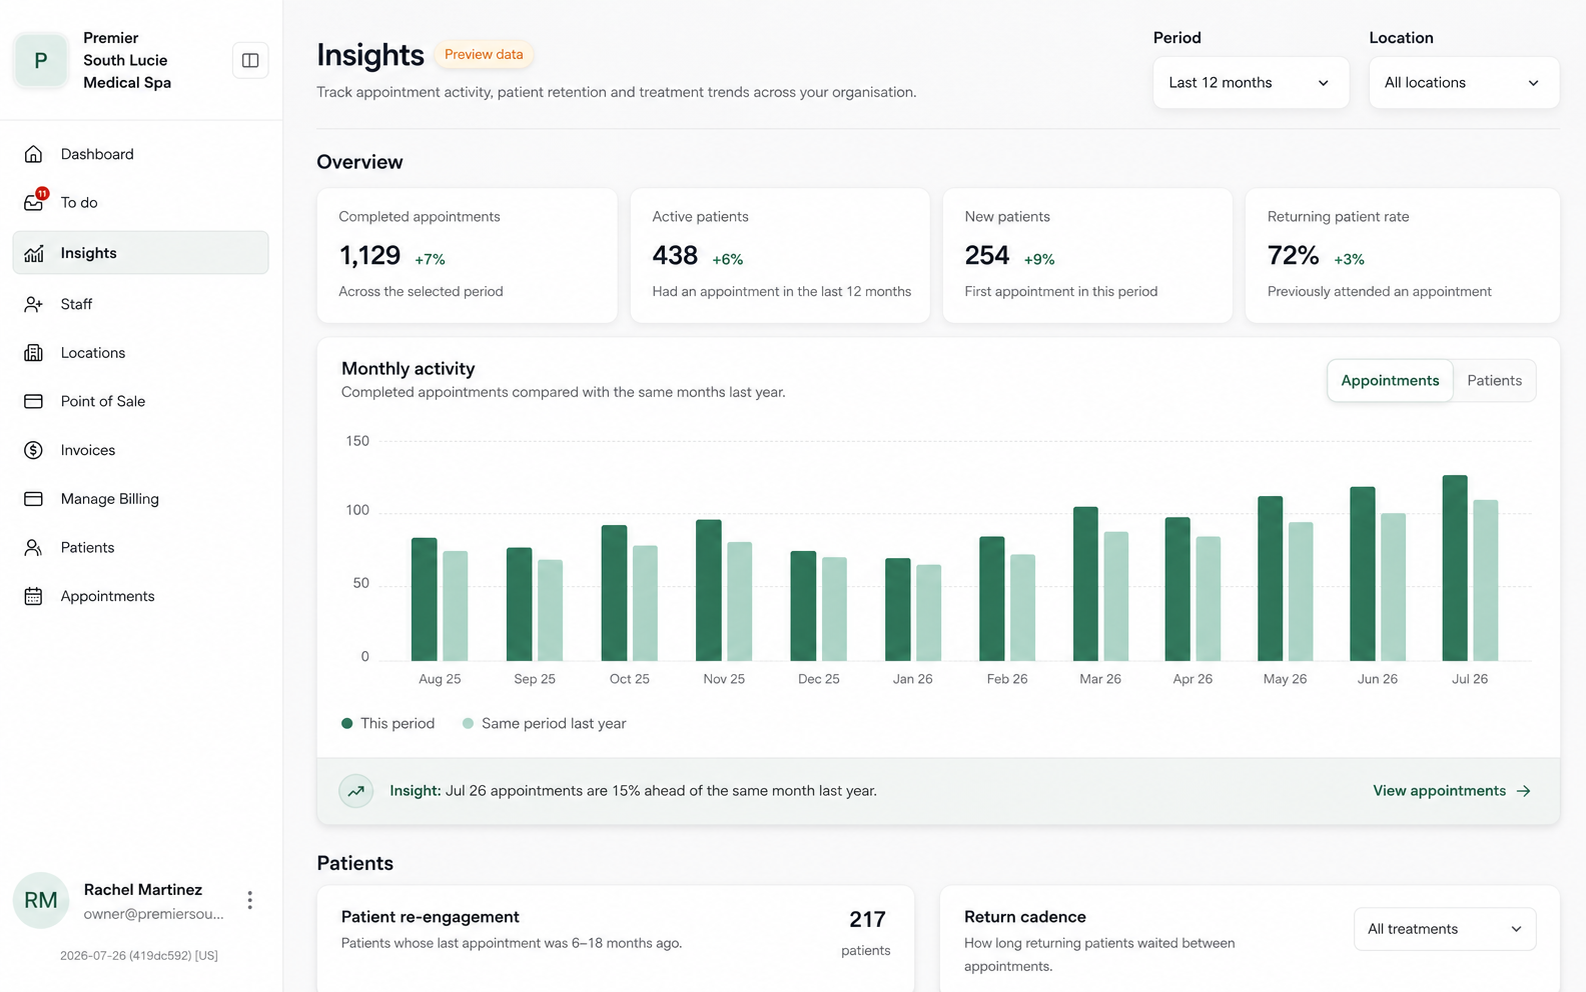
I designed and built the Insights Dashboard from scratch for clinic owners and practitioners. It turns appointment, patient, treatment and dosage activity into clear views of clinic performance, patient re-engagement, treatment mix and privacy-safe regional market movement.
My ownership covered the customer experience, Phoenix LiveView frontend, D3 charts, Ash and PostgreSQL read models, SQL query design, Oban projection jobs, permissions, event tracking, load testing and production observability.
Problem
Fresh held the operational data clinics needed, but those tables were designed to run appointments, treatments, patients and Drugbook workflows—not to support analytical scans whenever a dashboard loaded.
Customers needed consistent answers to practical questions: Is appointment activity changing? Which patients are due to return? How is treatment mix shifting? How does dosage compare with a privacy-safe regional benchmark?
The product had to make those answers fast and understandable without slowing transactional workflows, leaking another clinic's data or allowing metric definitions to drift between charts.
How I built it
- I started with the customer decisions and wrote explicit metric contracts for activity, retention, re-engagement, return cadence, treatment mix, dosage and regional trends. That made edge cases such as qualifying appointments, first visits and suppressed comparison data part of the product definition.
- I built a dedicated Insights domain with disposable, denormalised fact tables. Appointments, treatments, patients and Drugbook remain authoritative; the facts snapshot only what the dashboard needs so interactive queries stay bounded and join-light.
- I wrote Oban jobs that publish organization facts atomically each night, reconcile them weekly and support targeted rebuilds. Separate jobs publish dosage benchmarks and regional market trends, while failed refreshes retain the last known good generation.
- I shaped and optimised the PostgreSQL read path around indexed organization and date ranges. Aggregation and percentile work stays in SQL, dashboard queries run sequentially to avoid connection-pool fan-out, and stable query tags make production traces easy to identify.
- I implemented the privacy and authorization boundary in the read model. Administrators receive their authorized organization scope, practitioners are pinned to their own scope, and network comparisons require at least 20 treatments across three organizations before a result can be published.
- I built the responsive LiveView experience and D3 charts, added loading and failure states, instrumented the product, and tested the complete path with representative and high-volume datasets before release.
Value
The dashboard gives clinic teams one place to understand performance and identify where attention is needed, while the fact-backed architecture keeps that experience fast as operational data grows.
- Better clinic decisionsOwners and practitioners can act on appointment movement, patient returns, treatment patterns and dosage trends without assembling the analysis themselves.
- Fast by designIn representative load testing with 7,500 appointments, 2,500 patients and 30,000 annual observations, the complete dashboard data load ran in 159 ms after a one-second fact publication.
- Privacy-safe contextRegional trends and dosage ranges add useful market context without exposing raw organization counts or allowing a clinic's contribution to be identified.
- Built to scaleA separate market harness rebuilt publications across 1,000 organizations, 300,000 appointments and one million treatments in 4.32 seconds; interactive requests read only the compact published result.